Monitor Server with Prometheus and Grafana
Prometheus is used an open source software, that can collect metrics and alerting. You can download latest version oof Prometheus

Server Monitoring
Monitor Server with Prometheus and Grafana https://my-netdata.io/ sensu Zabbix Monit https://vector.dev/ Auto Restart MySQL if Crashed PHP Script to monitor
Configure Munin Node
To install munin node on Ubuntu/Debian, run To configure, edit file Find Below this line, you need to add IP
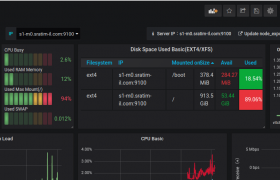
netdata
Install netdata on ArchLinux Disable Netdata Email Notification To install netdata, run Once installed, you will be able to see